Dark skies
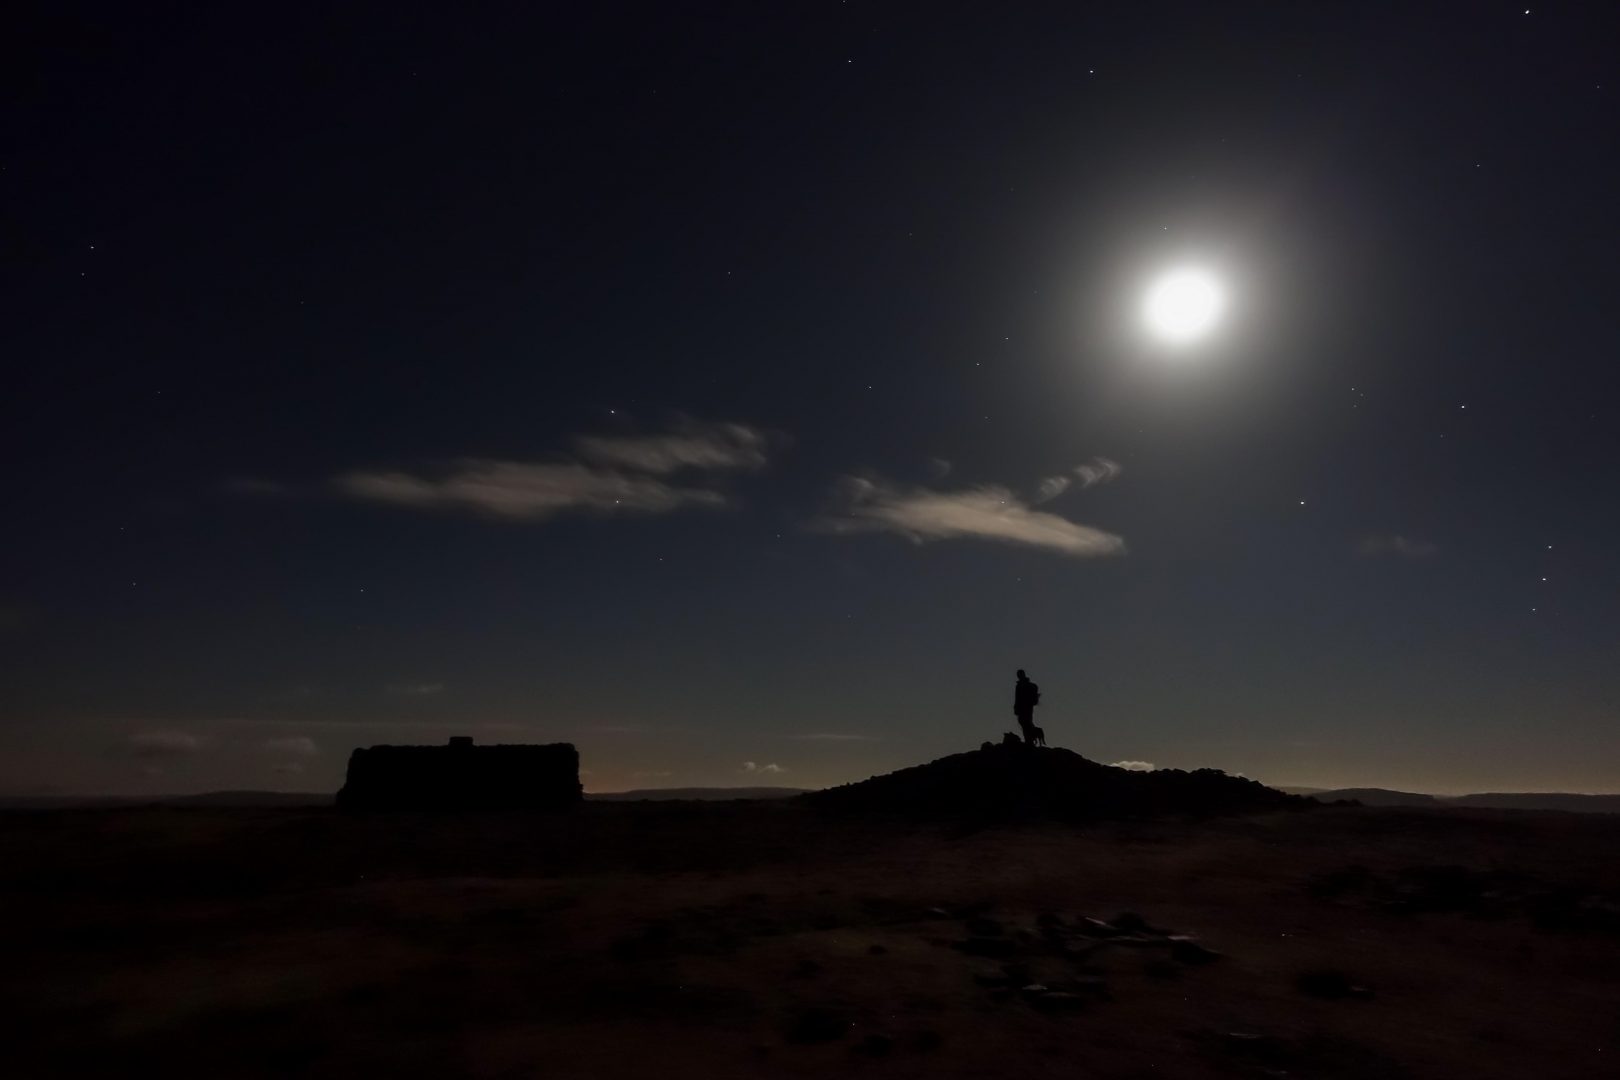
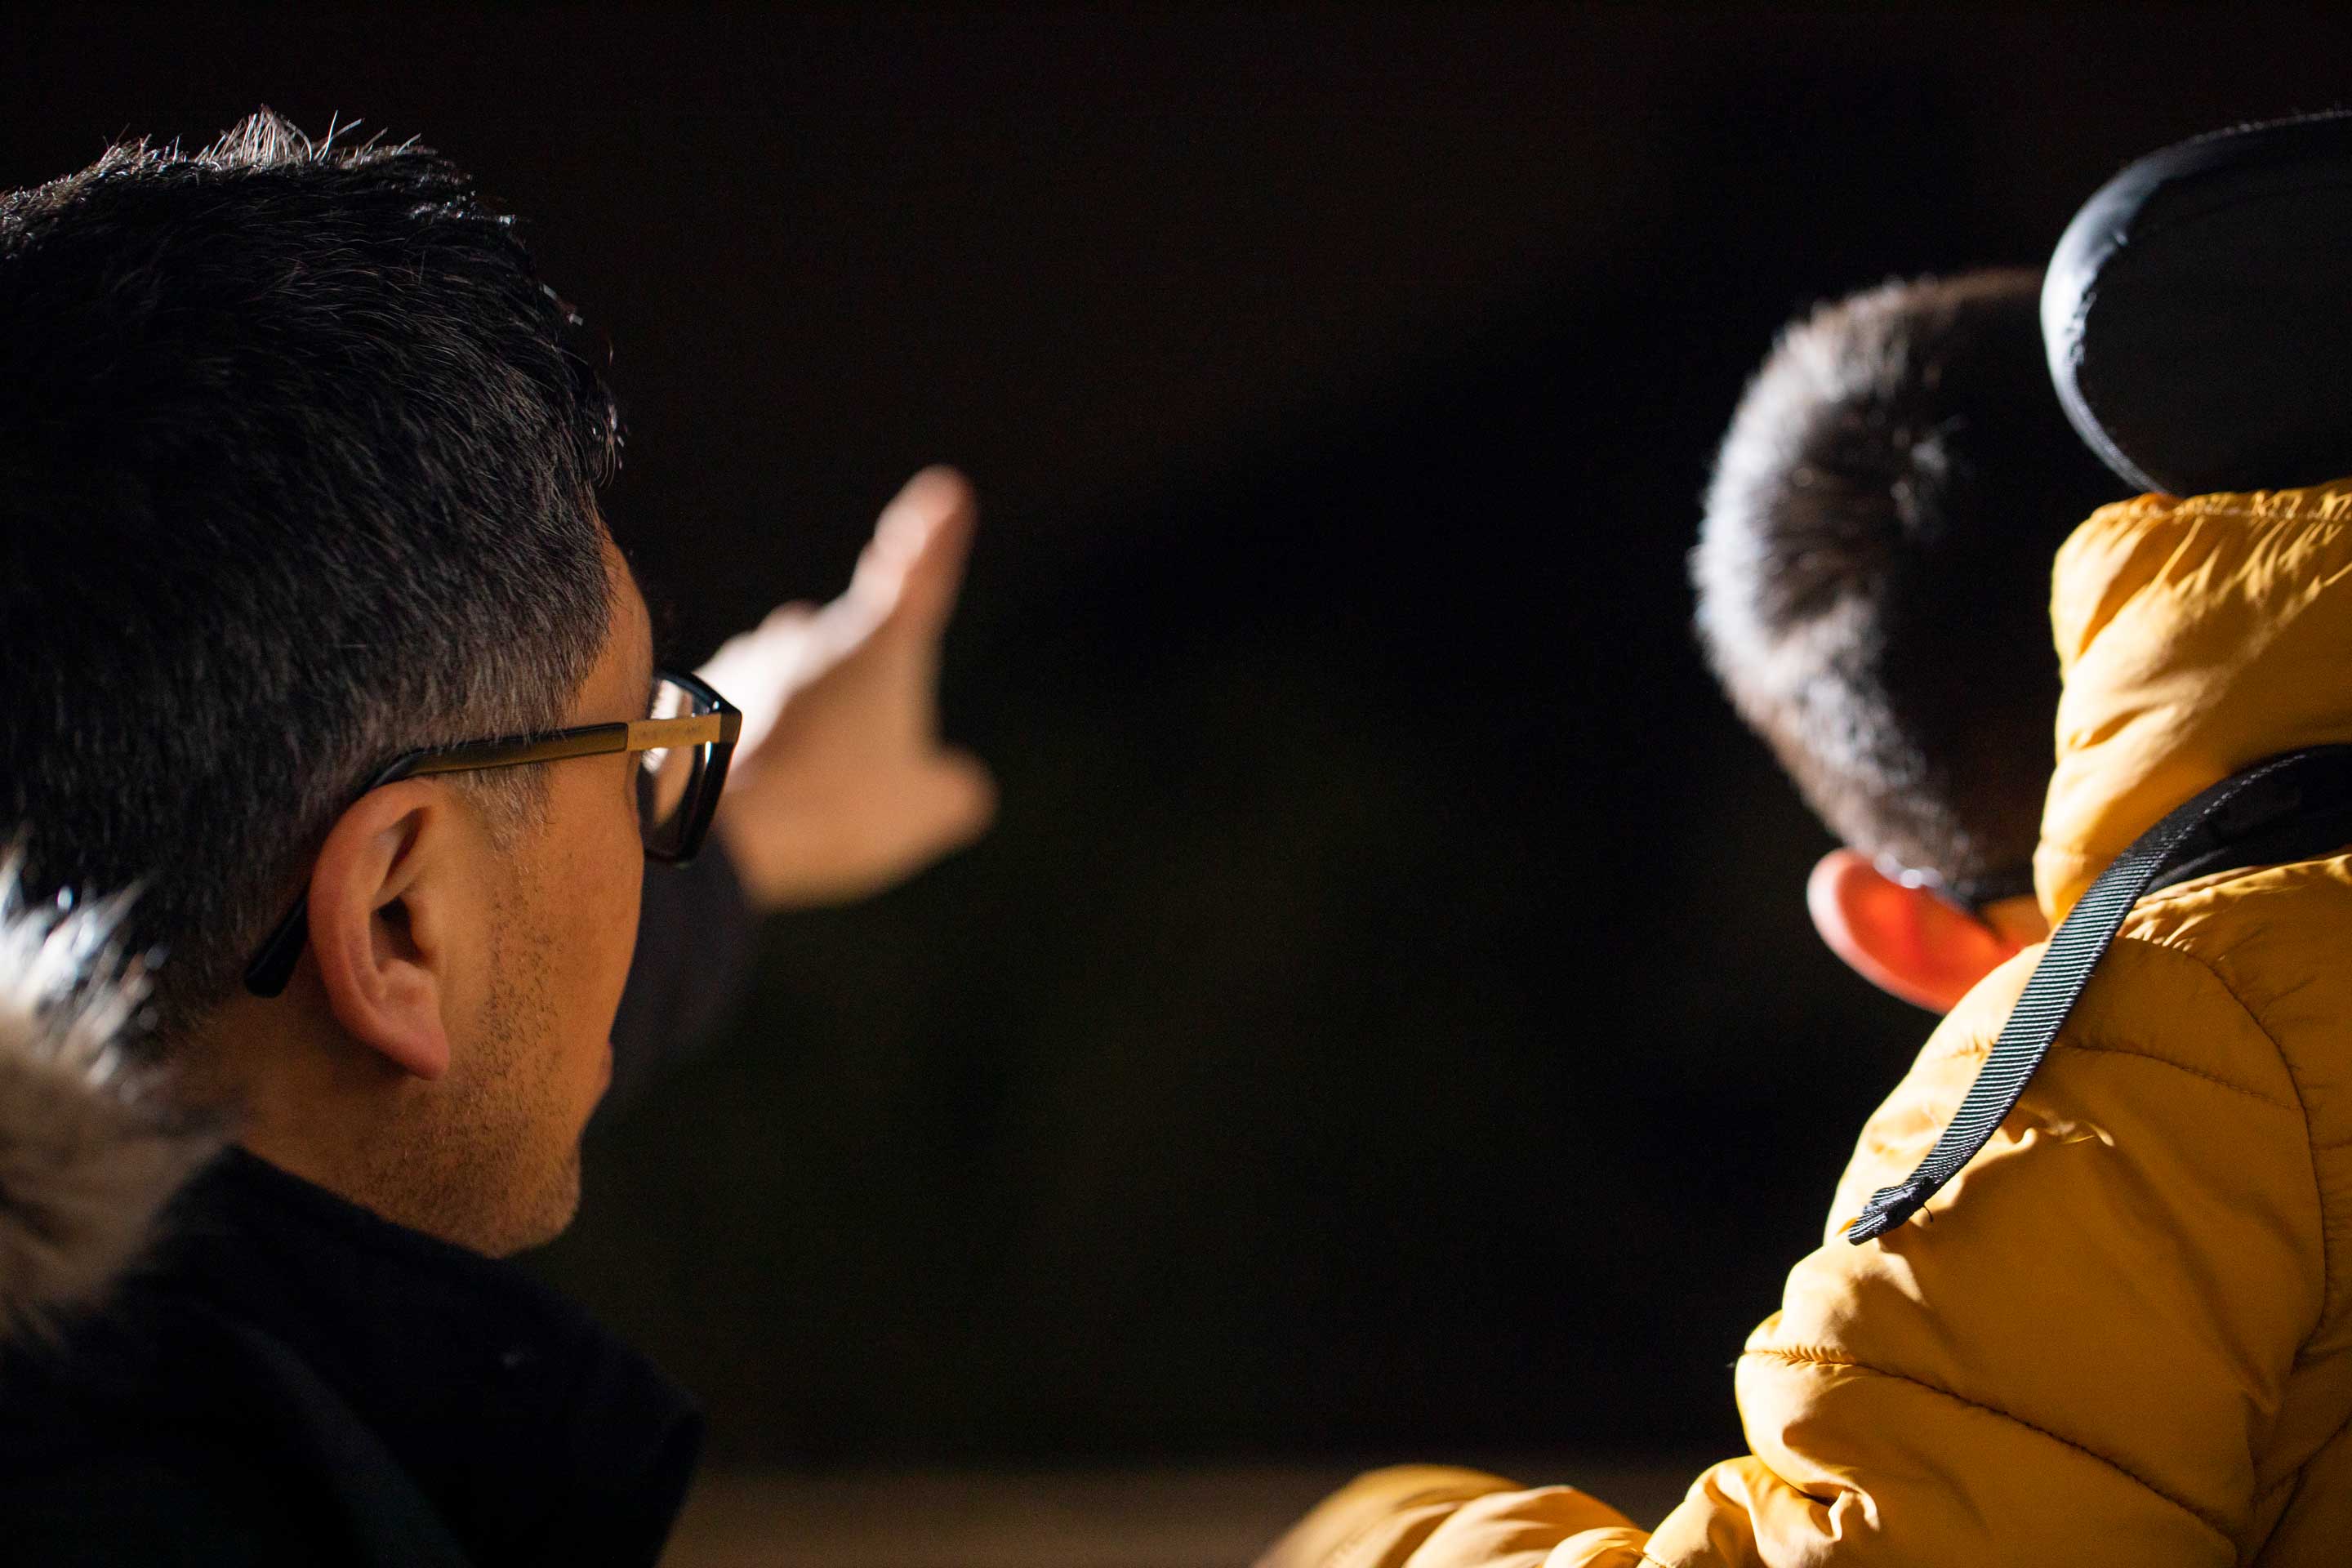
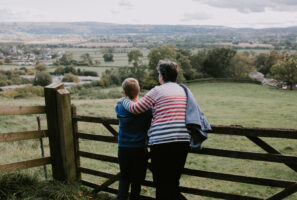
Moonlit walk in Yorkshire Dales Rebecca Cole / Alamy
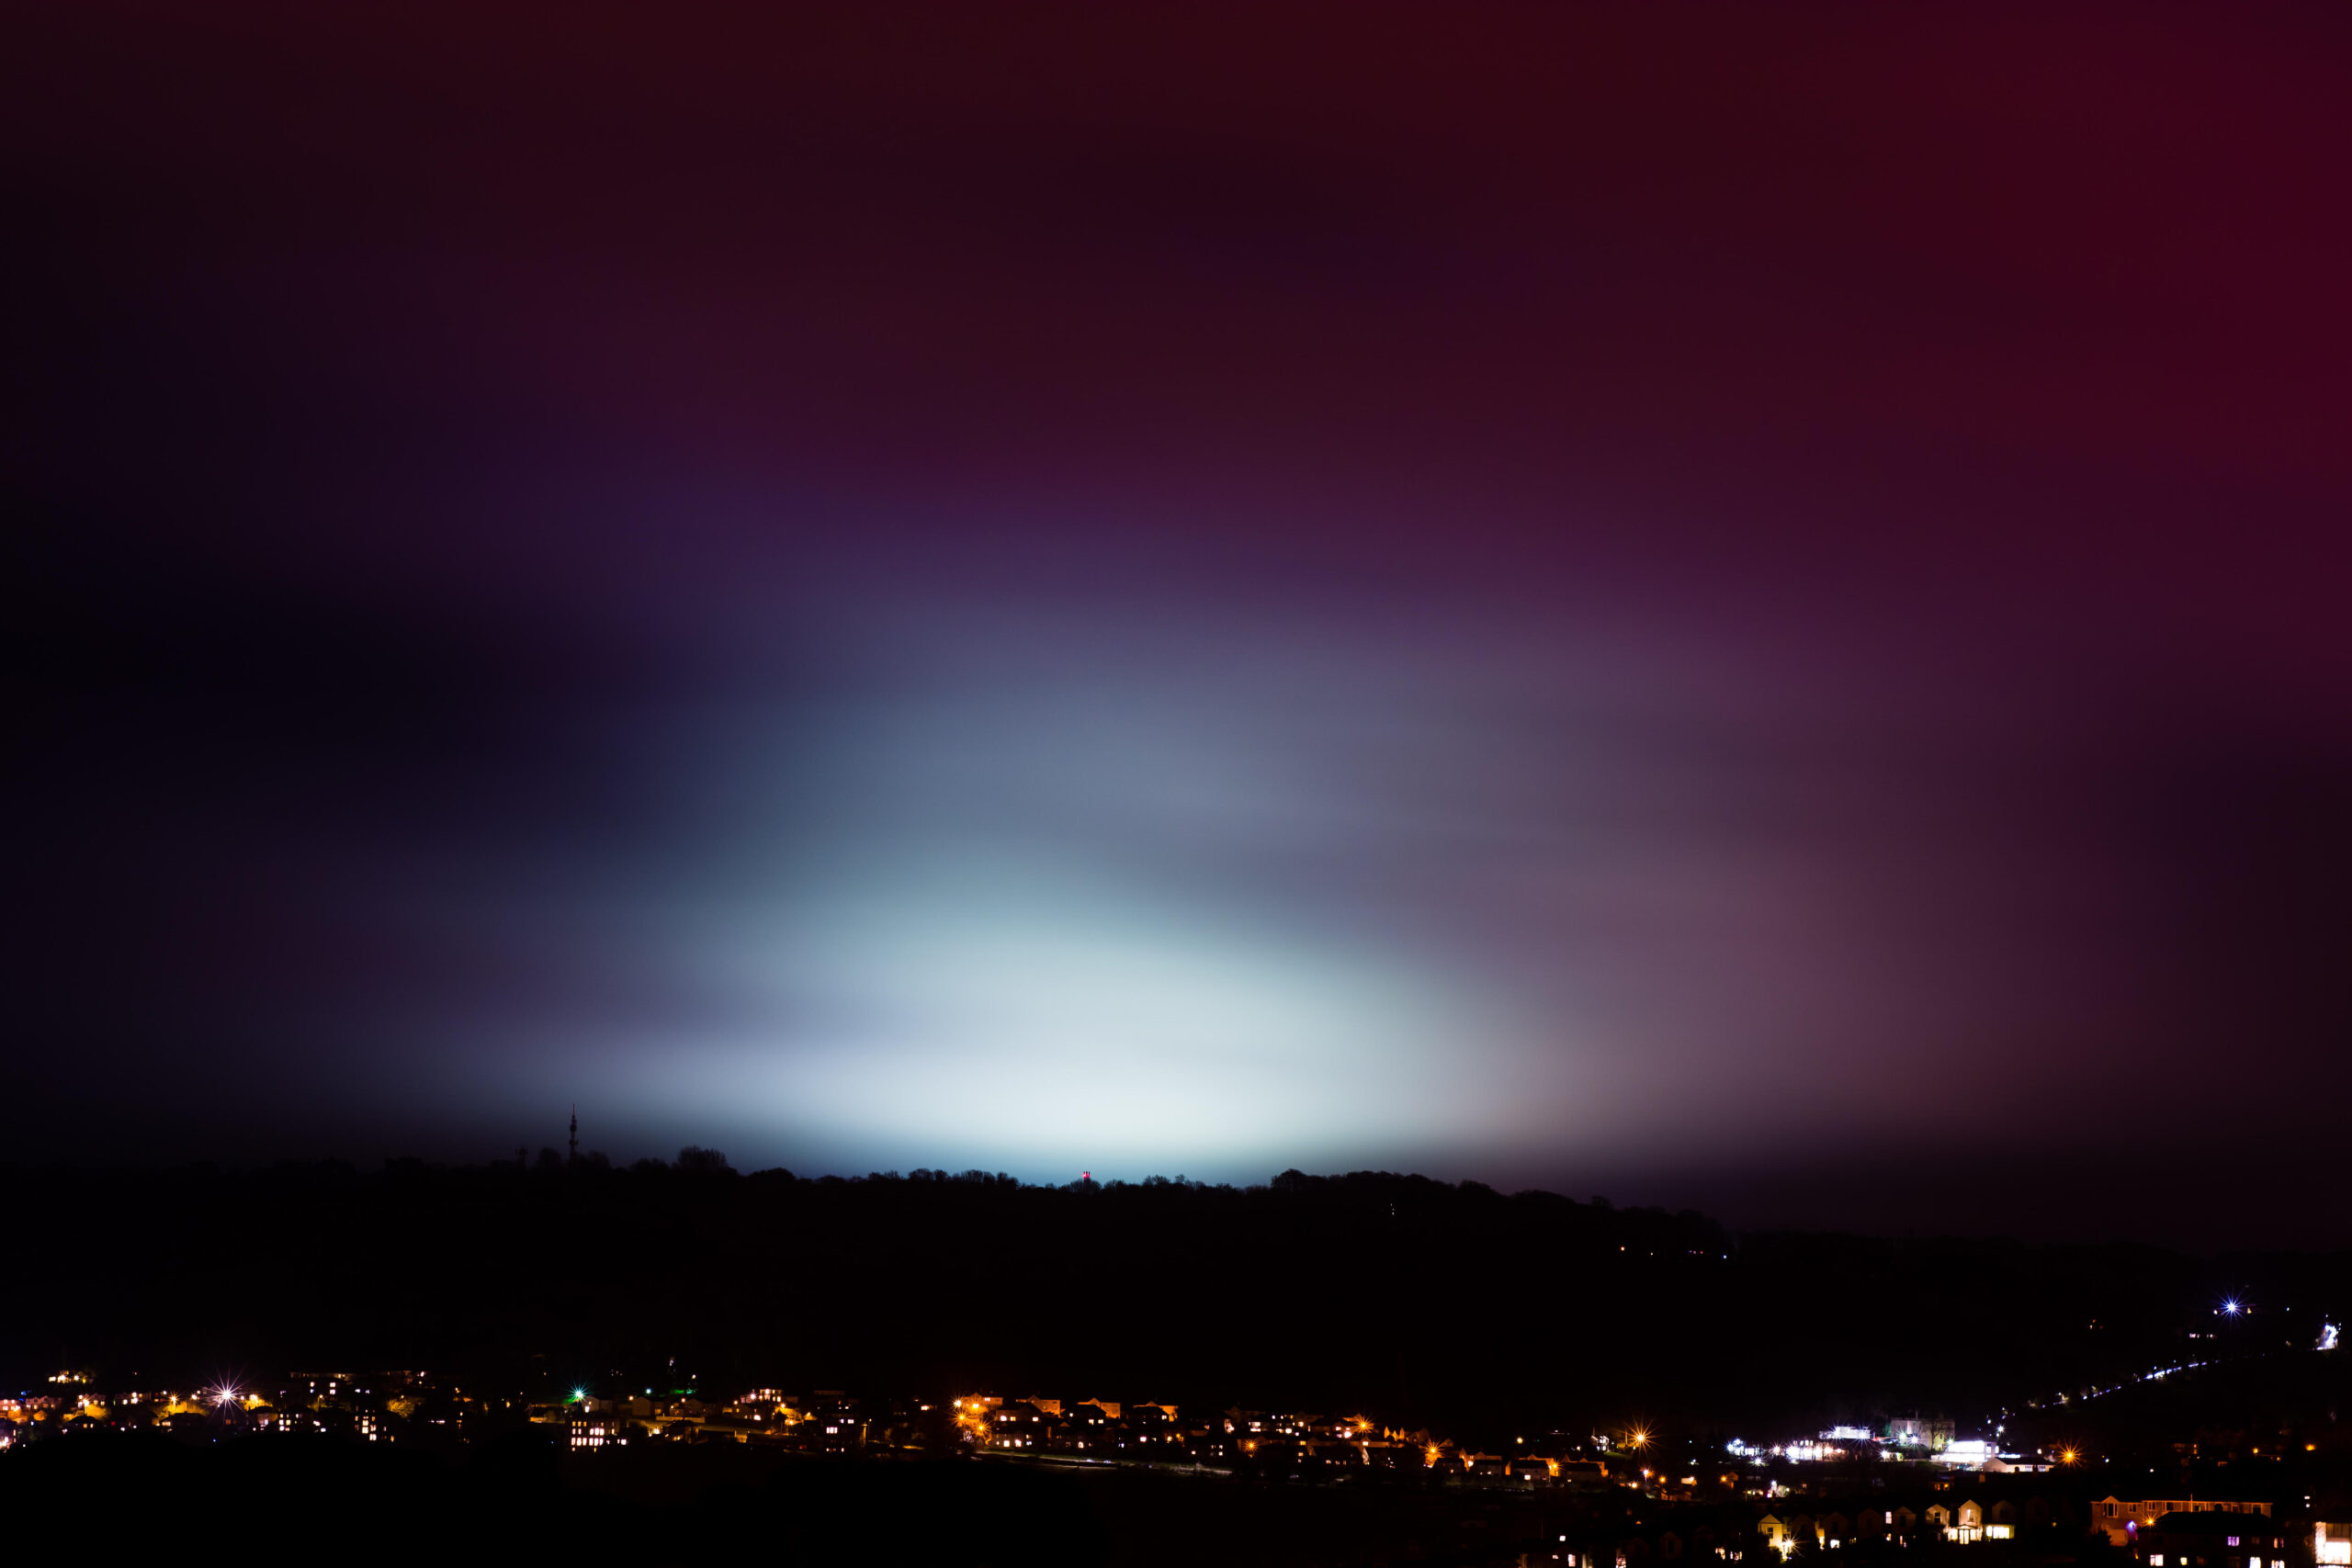
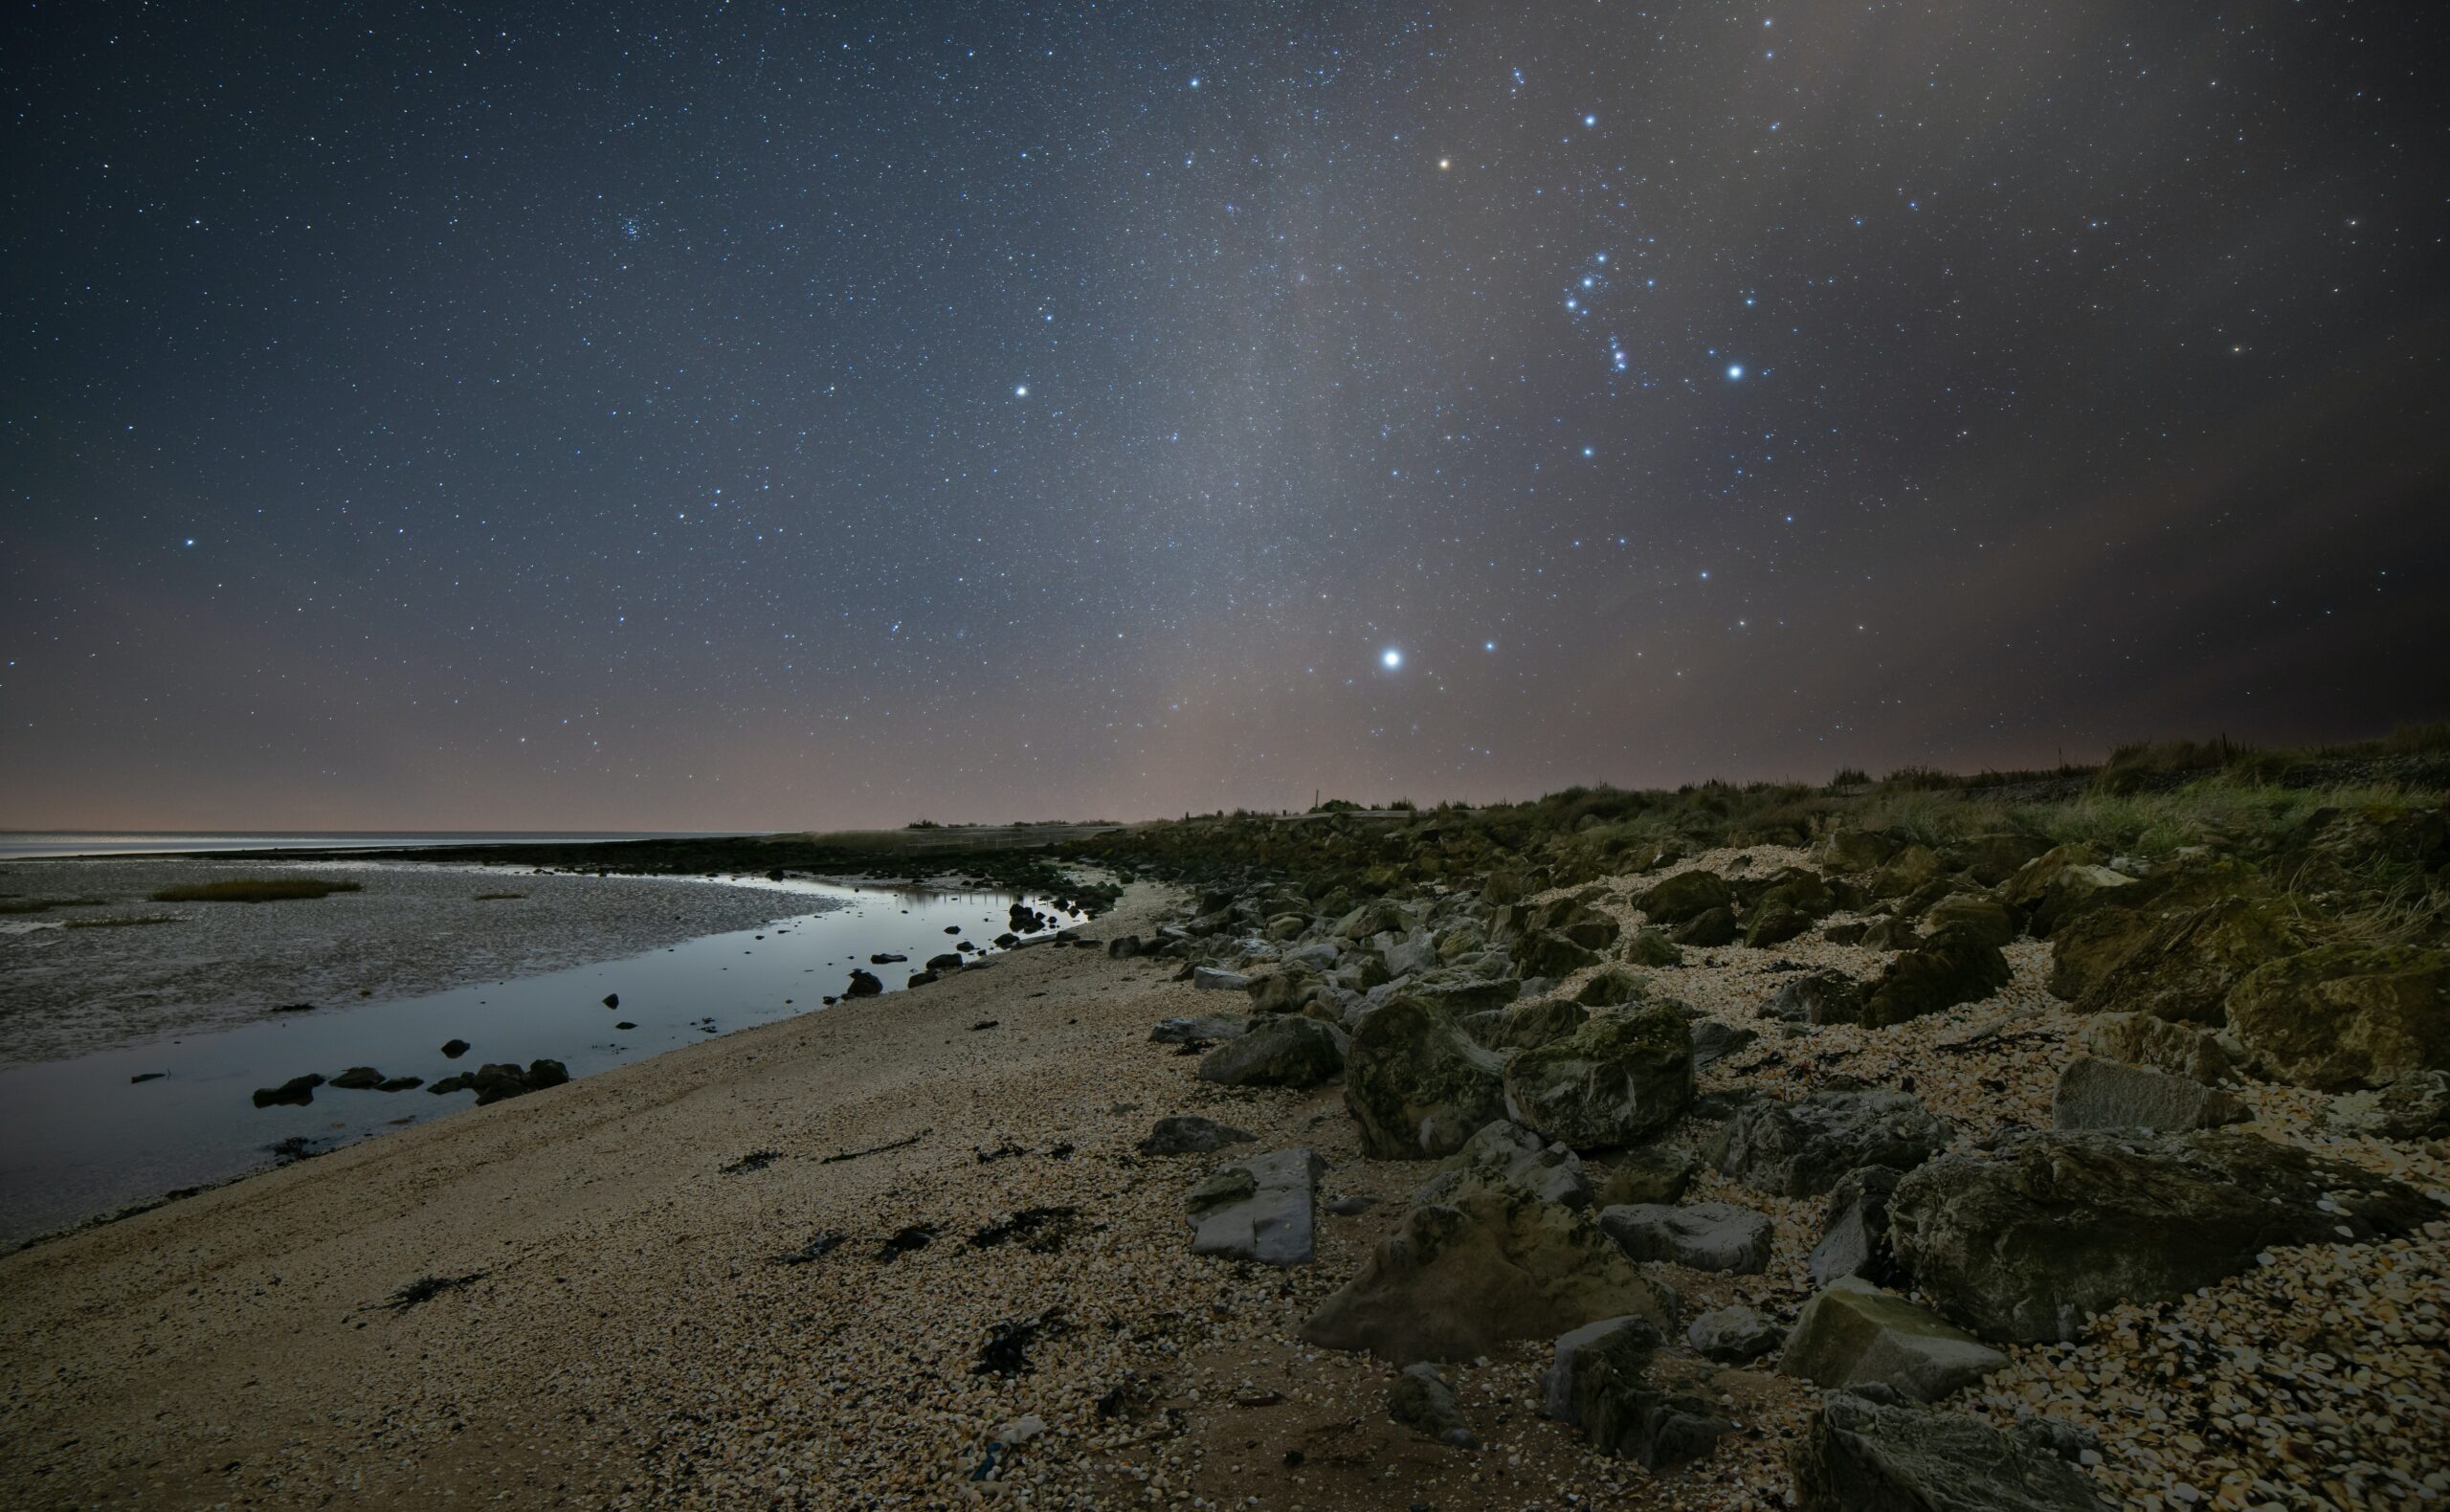
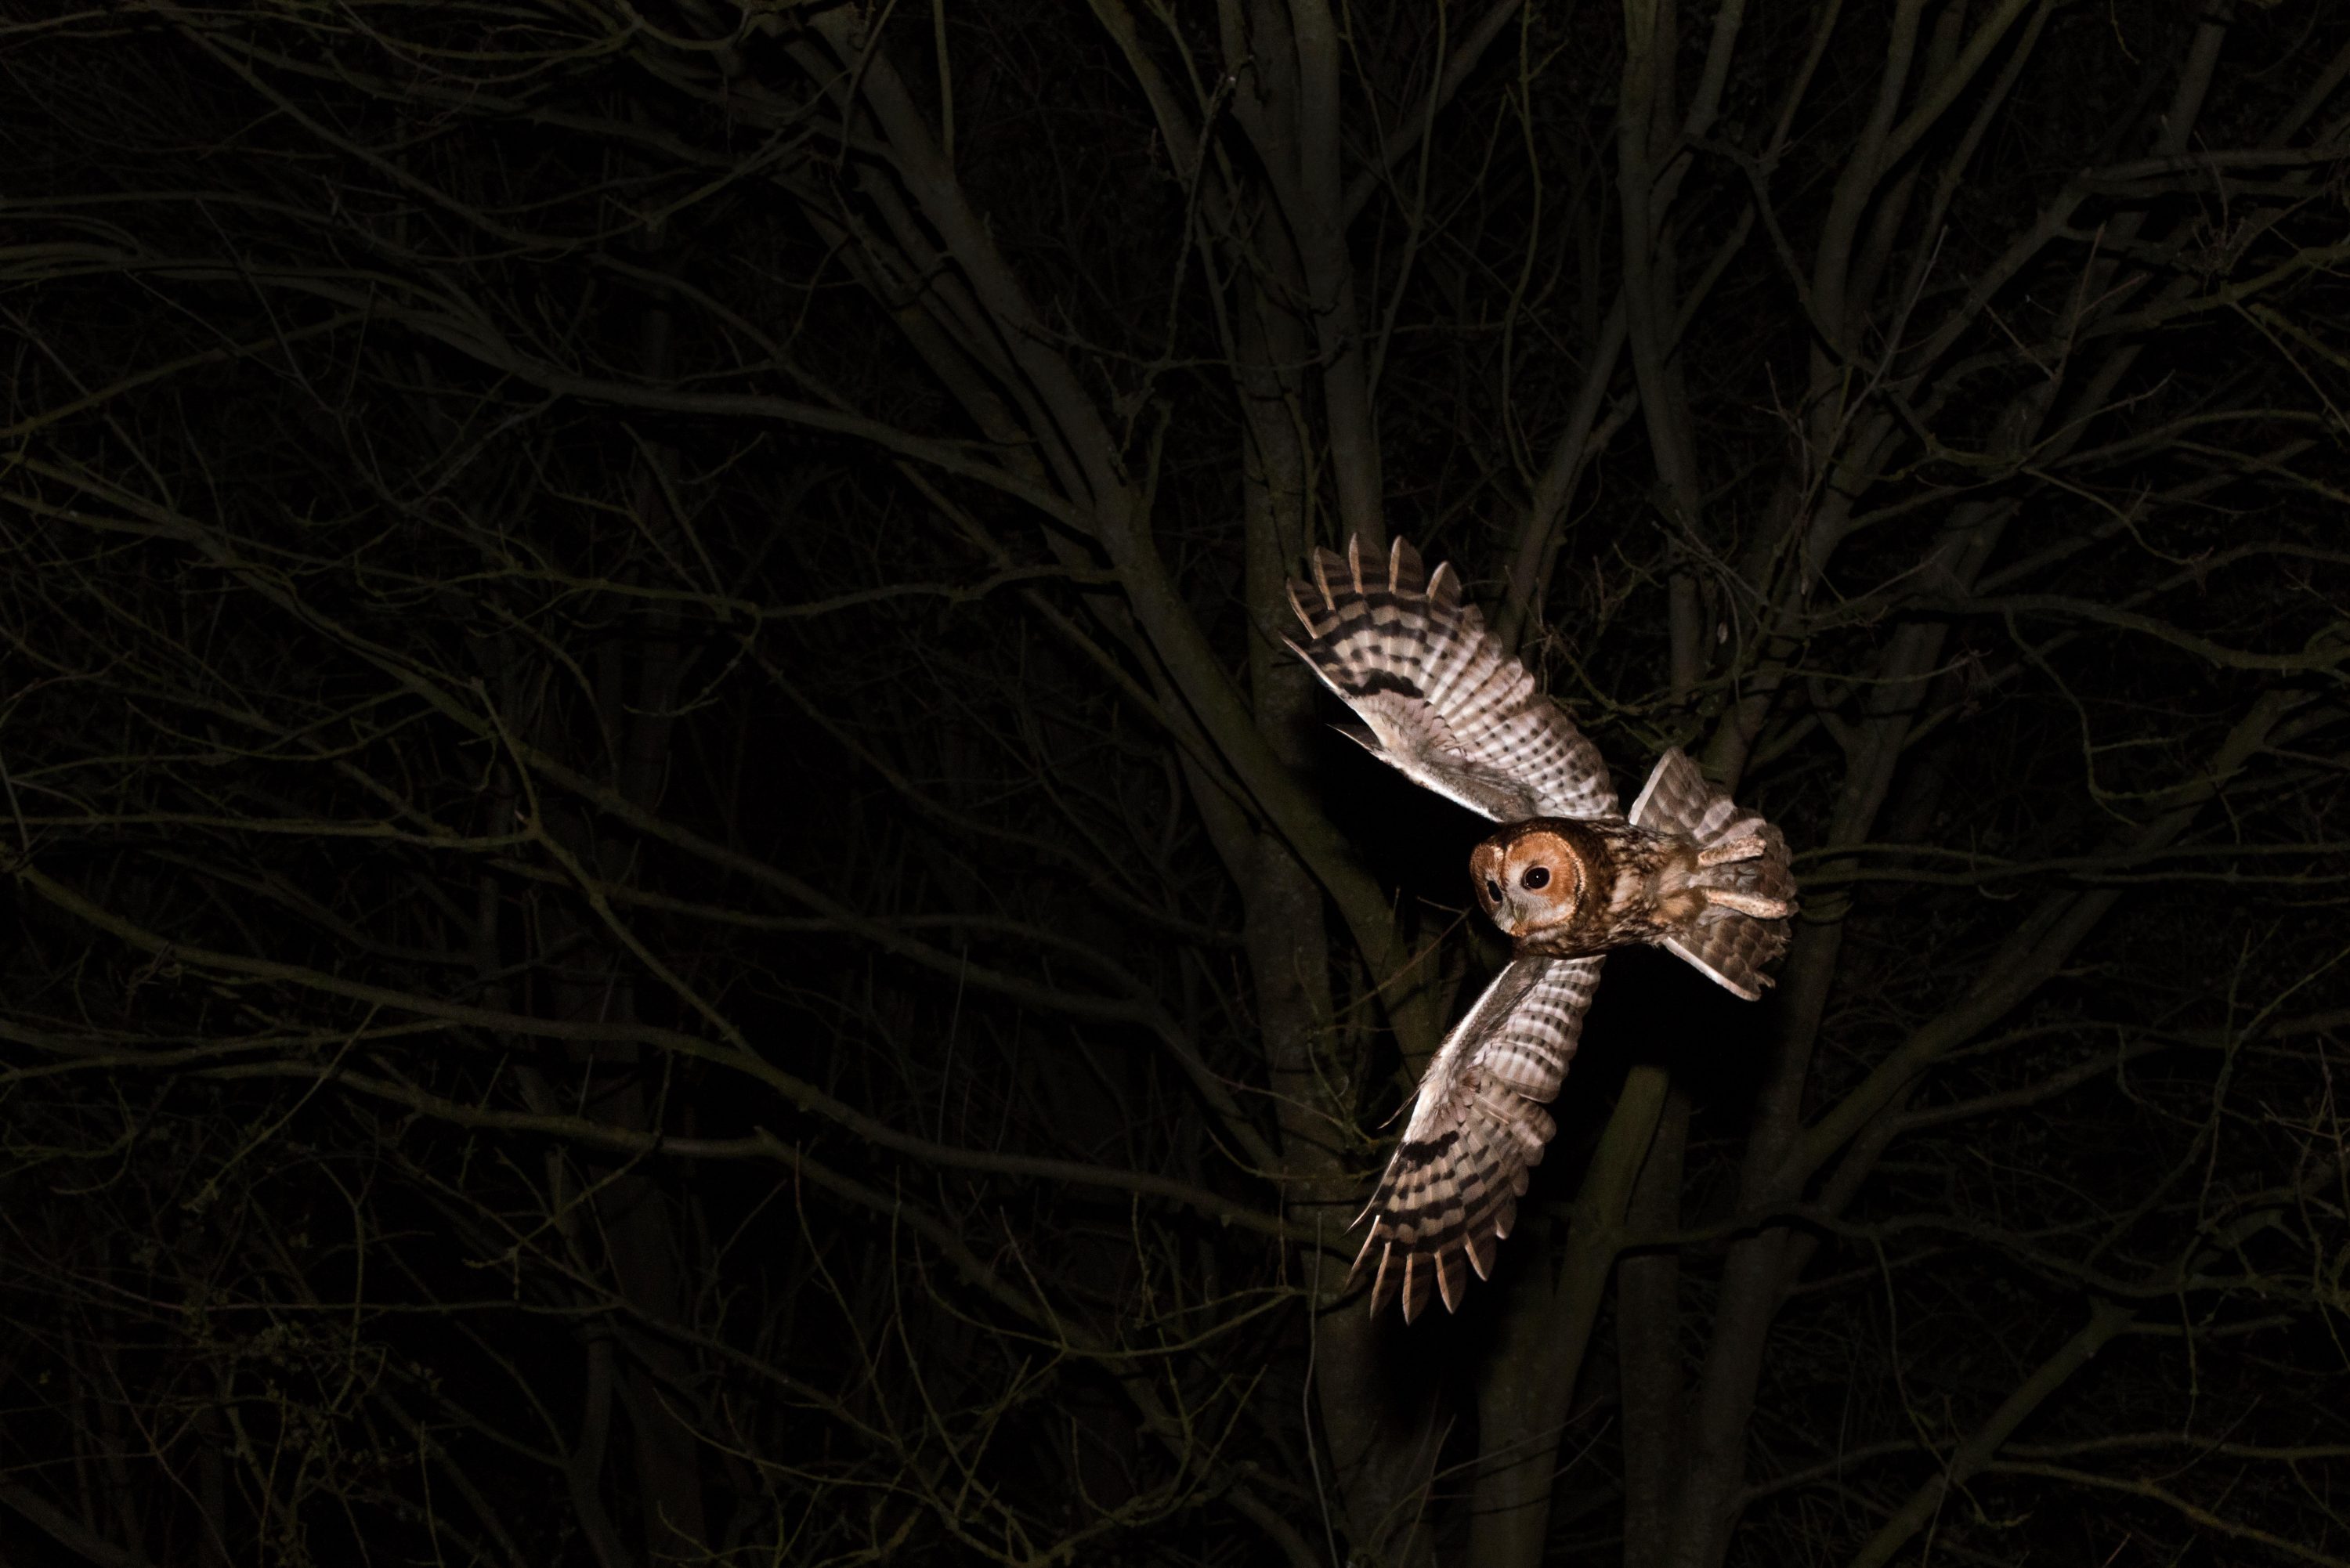
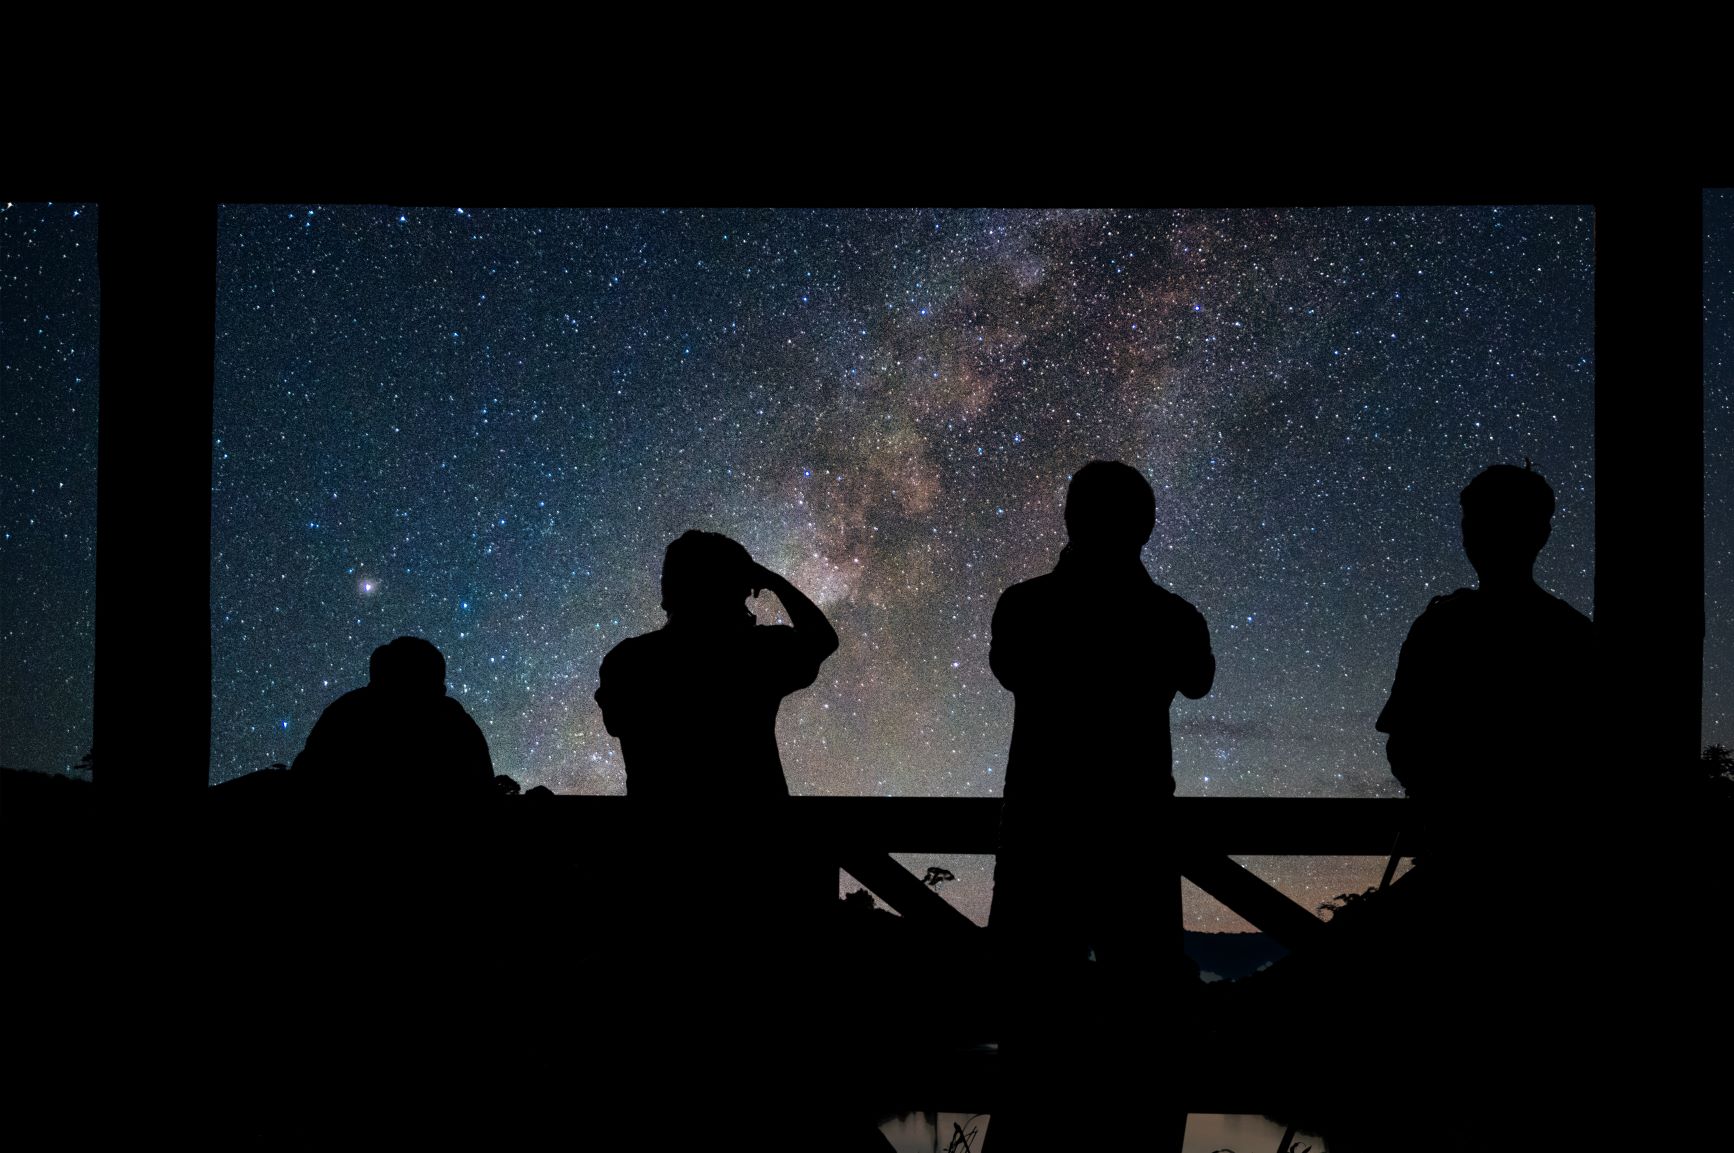
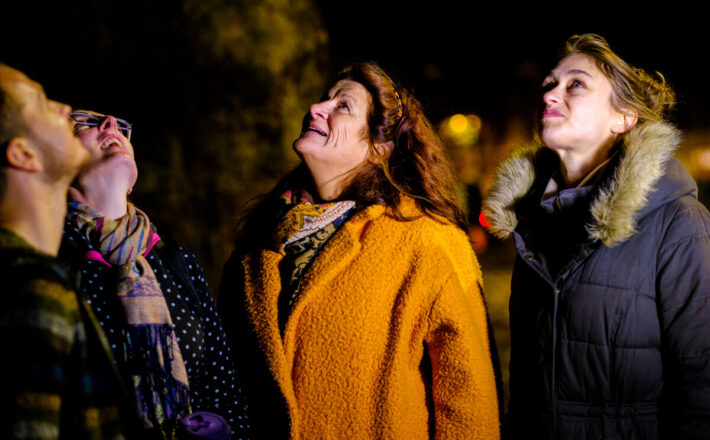
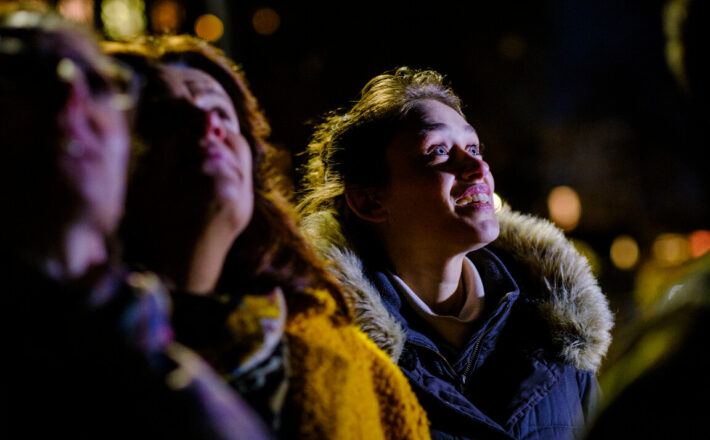
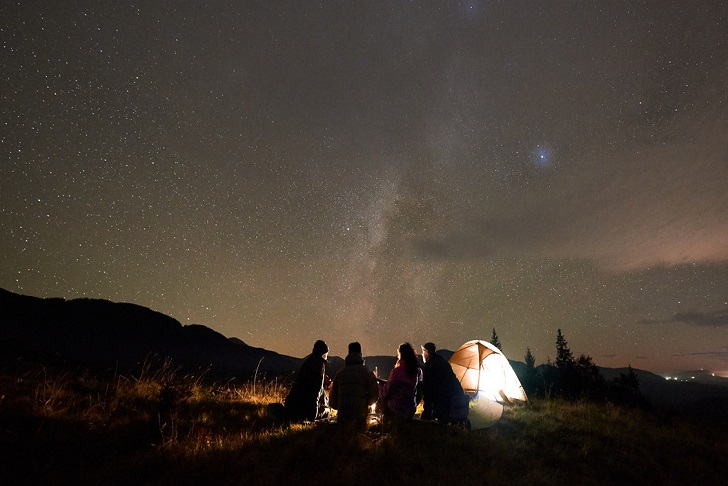
Starry skies are one of the most magical sights the countryside can offer. Light pollution not only limits our views of these skies but also disrupts wildlife’s natural patterns. We want to reclaim our dark skies.
We run an annual star count, helping us to see where light pollution is a problem and where the darkest skies are. We use this evidence to advocate for better-controlled lighting, and we offer advice about what we can all do to reduce local light pollution. You can view the 2023 results here.
On this page you can explore our light pollution and dark skies map, find out more about Star Count, light pollution and how we’re campaigning to protect dark skies.


Explainers
Dive deeper into the topics we care about with our handy explainer guides.
 5 min read